Reverse Engineering Malware, Part 5: OllyDbg Basics
- OTW
- Sep 2, 2021
- 5 min read
Updated: Dec 28, 2022
In this series, we are examining how to reverse engineer malware to understand how it works and possibly re-purposing it. Hackers and espionage agencies such as the CIA and NSA, regularly re-purpose malware for other purpose.
Previously, we looked at the basics of IDA Pro, the most widely used disassembler in our industry. In this tutorial, we will look at one of the most widely used and free debuggers, OllyDbg.
OllyDbg is a general purpose Win32 user-land debugger. It has an easy-to-use and fairly intuitive GUI making it a relatively quick study. Although OllyDbg is free, it is NOT open source as we do not have access to the source code. Despite this, OllyDbg has a well-defined plug-in architecture making it easily extensible to developers who want add capabilities to this powerful tool.
If you are using Kali or another security distribution, it is usually installed on your system. OllyDbg will run in either Windows or Linux and, in fact, it requires WINE to run in Linux. If you do not have OllyDbg on your system, you can download OllyDbg here.
Step #1: Starting OllyDbg
To start OllyDbg in Kali, go to Applications, then Reverse Engineering and finally ollydbg, as seen in this screenshot below.

When you do, it will open a screen like that below. Note that OllyDbg has the familiar pull-down menu system along the top of the GUI.

Step #2: Loading a File into OllyDbg
The next step is to load an .exe file into Ollydbg. You can do that by dragging and dropping the file into the work area of Olly or go to the File menu at the top and select Open. Note that the open window specifies that it must be an executable file.

When you click open, Ollydbg will begin the process of analyzing your code. In this case, I used a simple .exe that comes pre-installed on my flash drive named LaunchU3.exe for demonstration purposes only. Obviously, it is NOT malware. In future tutorials, we will use both malware and non-malware to debug and analyze. Debuggers such as OllyDbg are also useful for analyzing errors (bugs) in code for developers and also breaking authentication schemes that prevent piracy.
As you can see below, Olly, takes the code and breaks into several windows. In the upper left window we have the virtual addresses of the instructions, in the upper right window the CPU registers, in the lower left we have the data residing in memory and finally in the lower right window, we have the stack. Also, please note that in the lower right, highlighted in yellow, we have the status. In this case, it indicates that we are in "pause" status.

Step #3: Different Views of the Code
We can get different views of our data by clicking on the view button on the top menu. Note that each view is associated with a hotkey that is preceded by the Alt key with the exception of "patches" which uses the Ctrl key.

From here we can open a processes' logs (Alt+L), executables (Alt+E), memory layout (Alt +M), windows, handles and and its breakpoints (Alt+B). Note that each of these is also represented in the blue letters on the menu bar as shortcuts.
If we select the Executable modules (Alt+E) or the blue "E", we open a window with all the files executables like below.The Executable Modules Window shows the base virtual address to the far right, the virtual size of the binary in memory in the second column, the Entry Point’s virtual address in the third column, the name of the module in the fourth column, file version, and file path for each module loaded in the process. If the text appears in Red, that means the module was loaded dynamically.

From the executables window, we can right click and pull up a context sensitive window. From here we can do a number of things, but let's take a look at the "View names" window.

Here we see all the functions and imported functions used in the program. We can also access this window by using the Ctrl+N. By examining the executable's imported functions we can often decipher the malware's functionality. Microsoft's MSDN API documentation site (www.MSDN.microsoft.com) can be a useful resource for finding out what these functions do, the parameter’s these functions take in, and what these functions return.

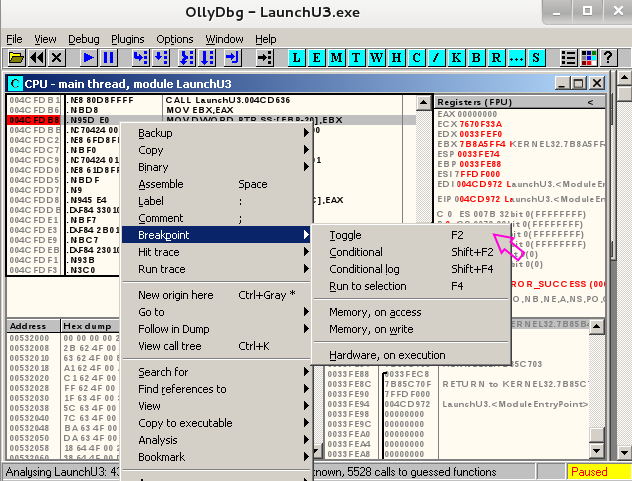
From the Names window, if we right click on the function names we can set a breakpoint by clicking on Toggle Breakpoint or F2.

OllyDbg’s Memory Map window shows the virtual address, the virtual size, the owner module, section names, memory allocation type and memory protection for each allocated region of memory in the process.

OllyDbg’s Threads window shows the thread ID, Entry Point virtual address, the Thread Environment Block (TEB) virtual address, the last-error value, status such as, active or suspended, the priority, and the timing information for each thread in the process.

The Windows window displays the Handle, Title, Parent Window, Window ID, Window Style, and Window Class Information for each window owned by the process.

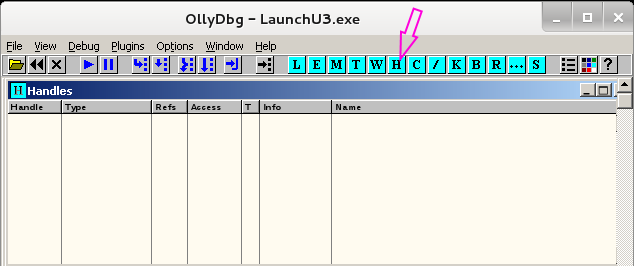
The Handles window shows the object type, reference count, access flags, and the object name for each handle owned by the process.

The SEH (Structured Exception Handler) chain window shows the Structured Exception Handler functions for the current thread.

Breakpoints
One of key features of any debugger is the ability to set breakpoints. A breakpoint enables us to stop the execution of a program at a specified address or instruction. There are two primary types of breakpoints (1) software and (2) hardware. OllyDbg provides a way to view and turn on and off breakpoints via the breakpoints window with Alt+B

OllyDbg Frequently Used Shortcuts
UI
Open new program F3
Close program Alt+F2
Maximize/restore active windows F5
Make OllyDbg topmost window Alt+F5
Close OllyDbg Alt+X
Windows
Open breakpoints window Alt+B
Open CPU window Alt+C
Open modules window Alt+E
Open log window Alt+L
Open memory window Alt+M
Editing
Add label : (Colon)
Add comment ; (Semicolon)
Edit memory Ctrl+
Assemble Space
Undo changes Alt+BkSp
Execution
Step into F7
Animate into Ctrl+F7
Step over F8
Animate over Ctrl+F8
Run application F9
Pass exception handler and run Shift+F9
Execute till return Ctrl+F9
Execute till user code Alt+F9
Trace into Ctrl+F11
Trace over Ctrl+F12
Pause F12
Pause trace conditional Ctrl+T
Run to selection F4
Breakpoints
Set/Unset breakpoint F2
Set/Edit conditional breakpoint Shift+F2
Set/Edit conditional log breakpoint Shift+F4
Temporarily disable/restore BP Space
Data
Analyze executable code Ctrl+A
Scan object files Ctrl+O
Display symbolic names Ctrl+N
Searching
Find selected address xrefs Ctrl+R
Find jumps to line Ctrl+J
Search for sequence Ctrl+S
Search allocated memory Ctrl+L
Search binary Ctrl+B
Search for a command Ctrl+F
Repeat last search Ctrl+L
Navigation
Go to origin * (Asterisk)
Go to address of expression Ctrl+G
Go to previous address - (Minus)
Go to next address + (Plus)
Go to previous procedure Ctrl+-
Go to next procedure Ctrl++
Go to previous reference Alt+F7
Go to next reference Alt+F8
Follow expression Ctrl+G
Follow jump or call Enter
View call tree Ctrl+K
Miscellaneous
Context sensitive help Ctrl+F
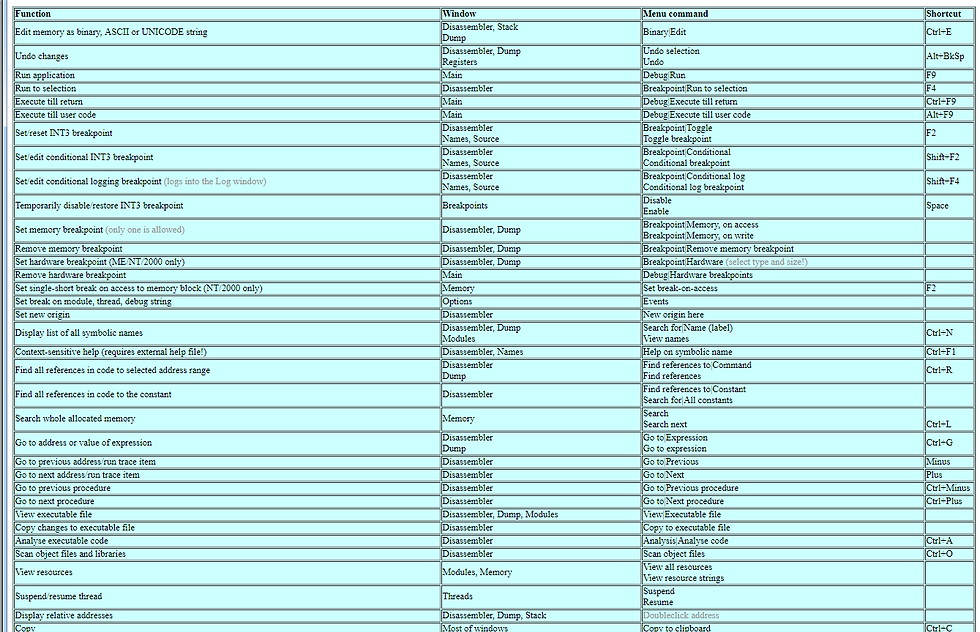
Complete List of Shortcuts
The following is a complete list of OllyDbg shortcuts from OllyDbg's official website www.ollydbg.de
Functions

Global Shortcuts

Now that we have demonstrated the two primary tools, IDA Pro and OllyDbg, as well as introduced you to Assembler Basics and Windows Internals, it is time to start reversing malware!