Reverse Engineering Malware, Part 3: IDA Pro Introduction
- otw
- Jun 22, 2017
- 6 min read
Welcome back to my Reverse Engineering Malware course!
This course is designed for those of you who want to ascend to the pinnacle of Digital Forensics and Cyber Security.

There are many tools available for reverse engineering, but one disassembler stands out: IDA Pro. Nearly everyone in the reverse engineering community uses IDA Pro to some extent. It’s a powerful disassembler capable of analyzing binary programs without the need for source code, allowing analysts to generate maps and various representations of the binary’s internal structure. IDA translates machine code into readable assembly code, helping us understand the behavior of the original program. It also includes an integrated debugger, though in this course, we’ll mainly focus on its disassembly features.
IDA Pro (Interactive DisAssembler) was originally developed by Ilfak Guilfanov and is currently maintained and sold by Hex-Rays, a company based in Liège, Belgium. IDA Pro is available for Windows, Linux, and macOS, but in this course, we’ll be using the Windows version.
Let’s get started with IDA!

Here is the version I’ll be using, which comes pre-installed in FLARE VM — a malware analysis distribution maintained by Mandiant.
You can get FLARE VM from its official GitHub repository:

Step #1 Download and Install
IDA Pro is commercial software, but you can download either the free version or the demo/evaluation version for this course. These versions have some limitations, such as;
(1) they will only work on x86/x64 code
(2) they will only work on PE/ELF/Macho-0 formats
(3) IDAPython is not available
(4) a few other limitations
After downloading IDA Pro, accepting the license agreement, and installing it should now be in your programs at the Start button in Windows. Locate it and click on the icon. When you do so, IDA will start up with a screen like below. Click on "New".

Step #2 Load a PE File
Since we are working with the demo version, we can only use Portable Executable (PE) files. We can now drag and drop a file into the working center window or click on File -> Open.

After selecting a file to disassemble (1) and open (2), the window below will pop up. As you can see, IDA was able to automatically determine the type of file (portable executable) and processor type (x64). Click on "OK."

When IDA begins its disassembly and analysis, it analyzes the entire file and places the information into a database. This database has four files:
Since this is a PE file (pe64.dll hint), it's likely compiled for x64
Enabled Analysis: Allows IDA to auto-analyze code and data sections, building the control flow graph (CFG).
Indicator enabled: Shows analysis status — useful for large binaries.
Rename DLL entries: Automatically renames IAT entries to more meaningful names (e.g., CreateFileW).
Create imports segment: Helps in reversing by mapping IAT.
metapc is the generic disassembler setting for x86/x64 architectures.
Click on ok
Whenever you close IDA, it will prompt you to save your current analysis as a database file. This database is saved as a single .idb (for 32-bit) or .i64 (for 64-bit) file, depending on the binary. You will be given the option to pack the database, either with or without compression.
Pack (Store) keeps everything in a single file without compressing it (faster to reopen). (1)
Pack (Deflate) compresses the database to save disk space but takes longer to load.
Don't pack leaves the data unpacked, which is faster but takes more space and creates multiple files.
These saved databases contain your function renaming, comments, and analysis progress. You’ll find them in the same directory as the binary you’re reversing. When people talk about the "IDA database," they’re referring to this .idb or .i64 file. See the screenshot below

Step #3 Start the Disassembly
In this lab, I will be using the REMCOS RAT sample. Here is the MD5 Hash: bb4e854c0d688aa146fda21e3e20b711 (becarefull it is a real sample).
You can use any portable .exe (PE) that you want to disassemble it. When we open it, IDA Pro begins its disassembly process and displays the information like in the screenshot below.

In IDA Pro, the IDA View-A (1) serves as the primary disassembly window, presenting the assembly instructions of the analyzed binary in a linear and readable format. Adjacent to it, the Hex View-1 (2) displays the raw hexadecimal bytes of the executable, synchronized with the disassembly view for quick cross-reference between hex data and instructions. The Local Types panel (3) lists user-defined structures, typedefs, and enums, which are essential when reverse engineering malware that employs custom data structures. Meanwhile, the Imports tab (4) provides insight into all external functions used by the binary—crucial for identifying calls to Windows APIs often leveraged in malicious behavior. The Exports view (5) shows functions exposed by the binary, particularly relevant in DLL analysis or when exploring potential entry points used by the malware. On the left, the Function Names List (6) includes all detected routines within the binary, initially named generically (e.g., sub_401000) but typically renamed by the analyst as the reverse engineering process reveals their purpose. Finally, the Disassembled Code section (7) displays the selected function's low-level code, including prologue instructions and cross-references, allowing the analyst to study the program's control flow and logic in detail.
If we right-click, it displays the window shown below. Note that we can select Text View or any number of other options while in the IDA View. When we begin our analysis later in the course, we will be setting breakpoints in the code, F2.
Step #4 Right-click on the IDA View-A Panel

The colorful navigation bar at the top of the IDA interface visually maps out the memory layout of the loaded binary. Each color represents a different type of segment within the program: light blue for regular functions, blue for library functions, gray for unexplored regions, pink for instructions, green for Lumina matches, and black for padding or unmapped areas. This bar allows you to quickly locate where key components like code, data, and symbols reside in memory. By right-clicking on any colored section, you can instantly jump to that specific offset in the disassembly or hex view, allowing you to zoom in down to the instruction or even byte level. It’s an essential tool for efficiently navigating large and complex binaries, especially when analyzing malware with sparse or obfuscated code regions.

Step #5 View -> Graphs -> Flow Chart
One of the most interesting and enlightening views that IDA can provide us is the flow chart. The flow chart graphically displays the flow of the execution of the file, making it easier to understand. We can open it by going to the top menu bar and clicking on View -> Graphs -> Flow Chart. It will open a Flow Chart of the code similar to that below.

We can zoom in by going to the View menu at the top of the flow chart to get greater detail. In this way, we can view the program flow from each register, subroutine, and function.

Step #6 Show Imports
When we select the Imports view, IDA will show us all the modules that the .exe imported. These imports can give us clues as to the origin of the malware.

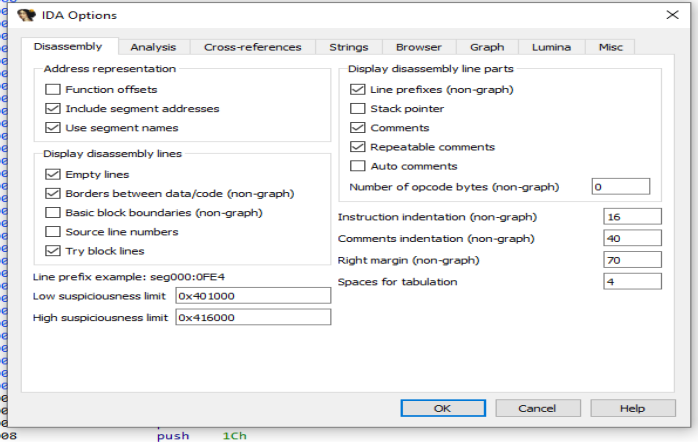
Step #6 Customize the Analysis
Finally, we can begin to customize what and how IDA displays the code to by going to Options -> General. A window like that shown in the screenshot below will enable us to customize our analysis.
Although this far from a complete and thorough introduction to IDA Pro, we are ready to use IDA Pro for some malware analysis! I will introduce additional concepts and techniques as you need them throughout the course.
Before you proceed, I think it is useful to introduce you to a few key commands and shortcuts in IDA Pro.

Also, please find a complete IDA Pro Quick Reference sheet courtesy of the good folks at www.datarescue.com (the original sales and marketing firm for IDA Pro).

Summary
Reverse Engineering malware is one of the most advanced disciplines in the cybersecurity field and Ida Pro is staple tool in this field. It has been the most widely used tool to disassemble and debug malware and other software. Since the release of Ghidra by the NSA, many analysts are moving to this tool especially those on a budget as Ghidra is free.
For more on Reverse Engineering malware, check out our series covering this subsject and our upcoming live courses.